What's new
Every feature, fix and change we ship to FxJournalStats.
November 2026
Calendars Follow Your Journal's Display Units
A calendar with display modes on now uses your journal's Display units settings, so you only set your R column, starting balance and default unit once.
What Carries Over #
When the calendar's Profit/Loss column is the same as your journal's, any of these you leave empty on the calendar comes from the journal:
- R-Multiple column: the journal's R column.
- % Gain starting balance: the journal's starting balance.
- Lead with: the journal's default unit.
Change the journal's Display units and its calendars update too, open embeds included.
Simpler Calendar Settings #
New calendars no longer ask for columns and a balance. Their settings show what comes from the journal, a link to its Display units, the value labels and Lead with. Lead with uses the same $ | % | R tabs as the chart editor. Pick the journal's unit again to go back to following it.
Calendars that already have their own R column or starting balance, or have R or % Gain turned off, keep their full settings, with a Use journal's settings button to switch over. Calendars without display modes don't change.
Notion Charts in R and %
Pick an R column and a starting balance for a journal, and every chart and stat card can show R-multiples or % return instead of currency.
One Setting per Journal #
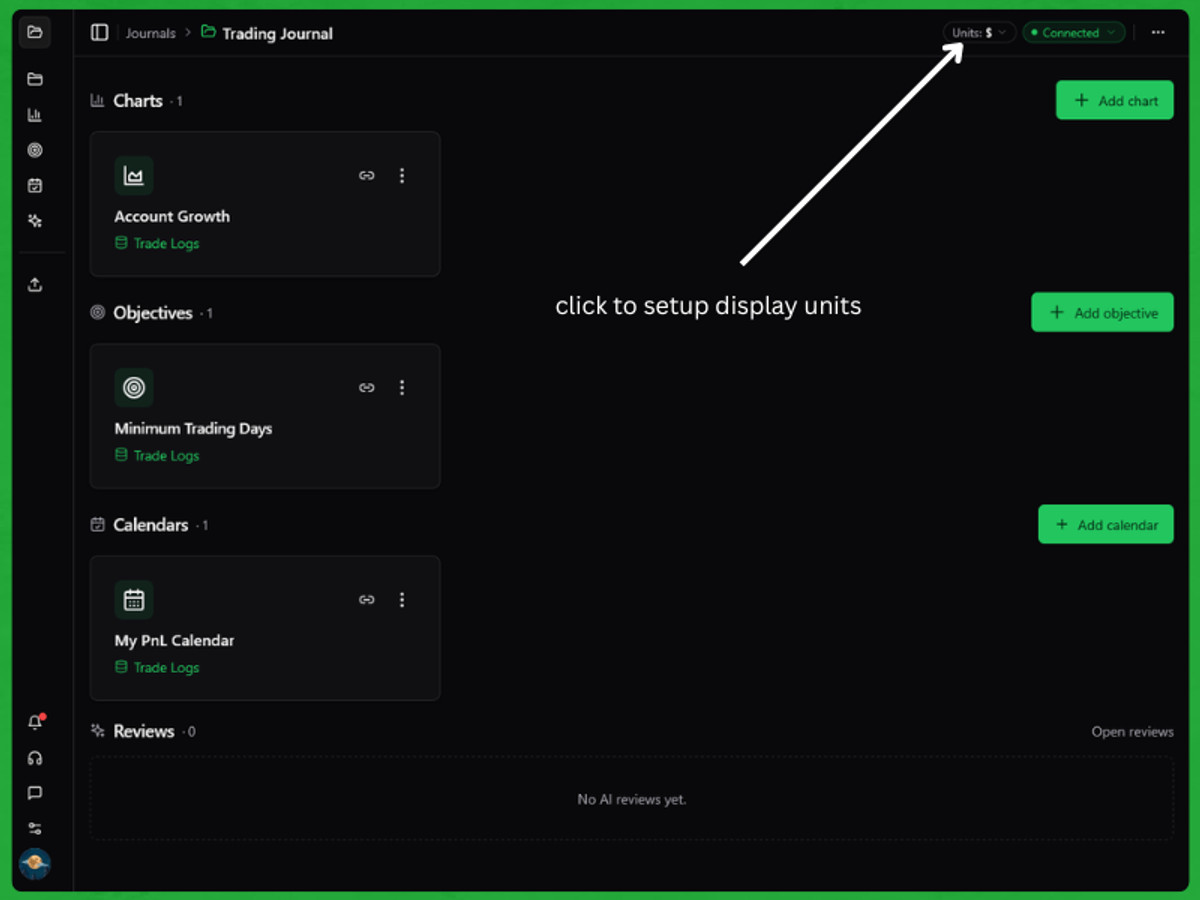
Open a journal and choose Display units from the … menu, or click the Units: $ chip at the top of the page. It sets the unit for all of that journal's charts: $, % or R. Choose the column that holds your P/L, the column that holds your R, and the starting balance % is measured against. The chip always shows the journal's current unit.
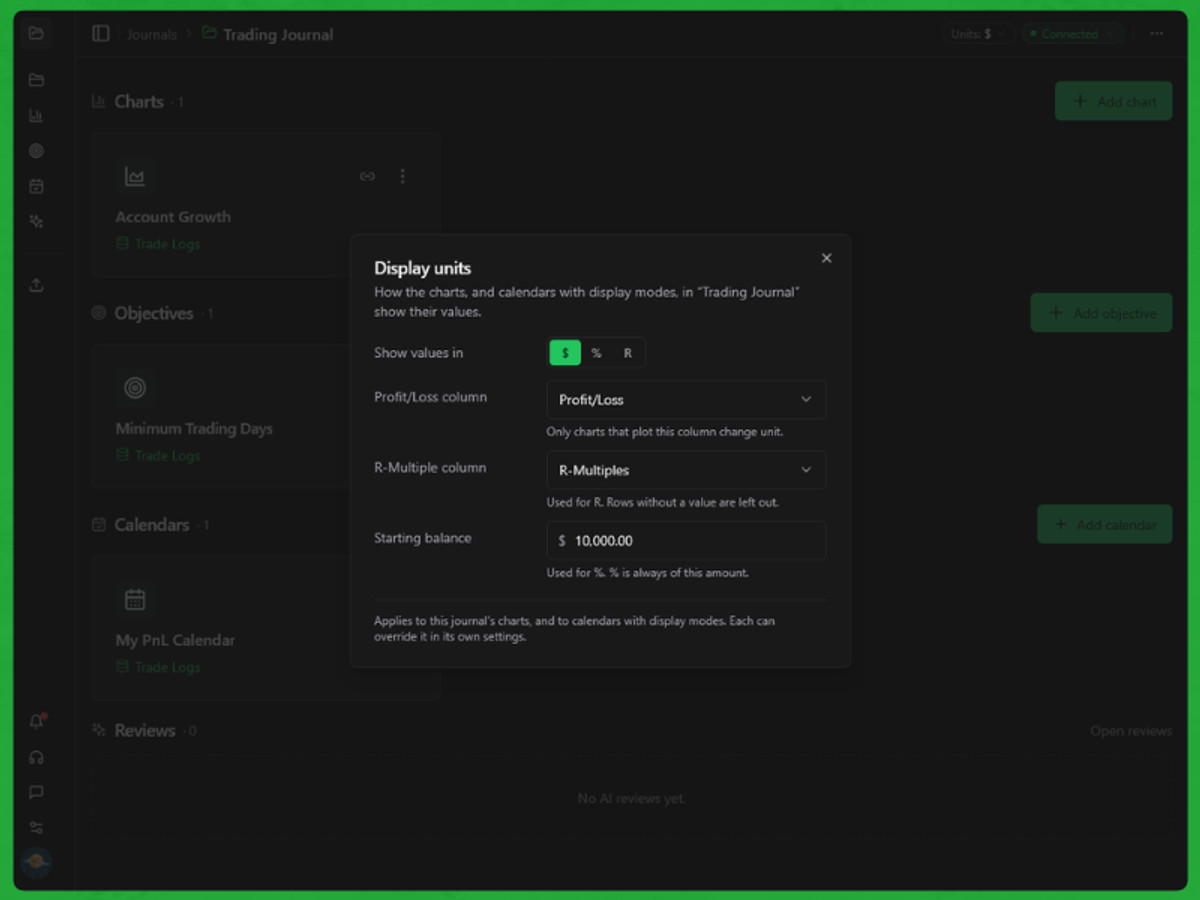
- R reads your R column. Trades without an R value are left out, and the chart says how many it covers.
- % is each trade's P/L divided by your starting balance, so the numbers add up. Drawdown in % is measured from your peak balance.
- Ratios like Win Rate and Profit Factor don't change with the unit.
Override Any Chart #
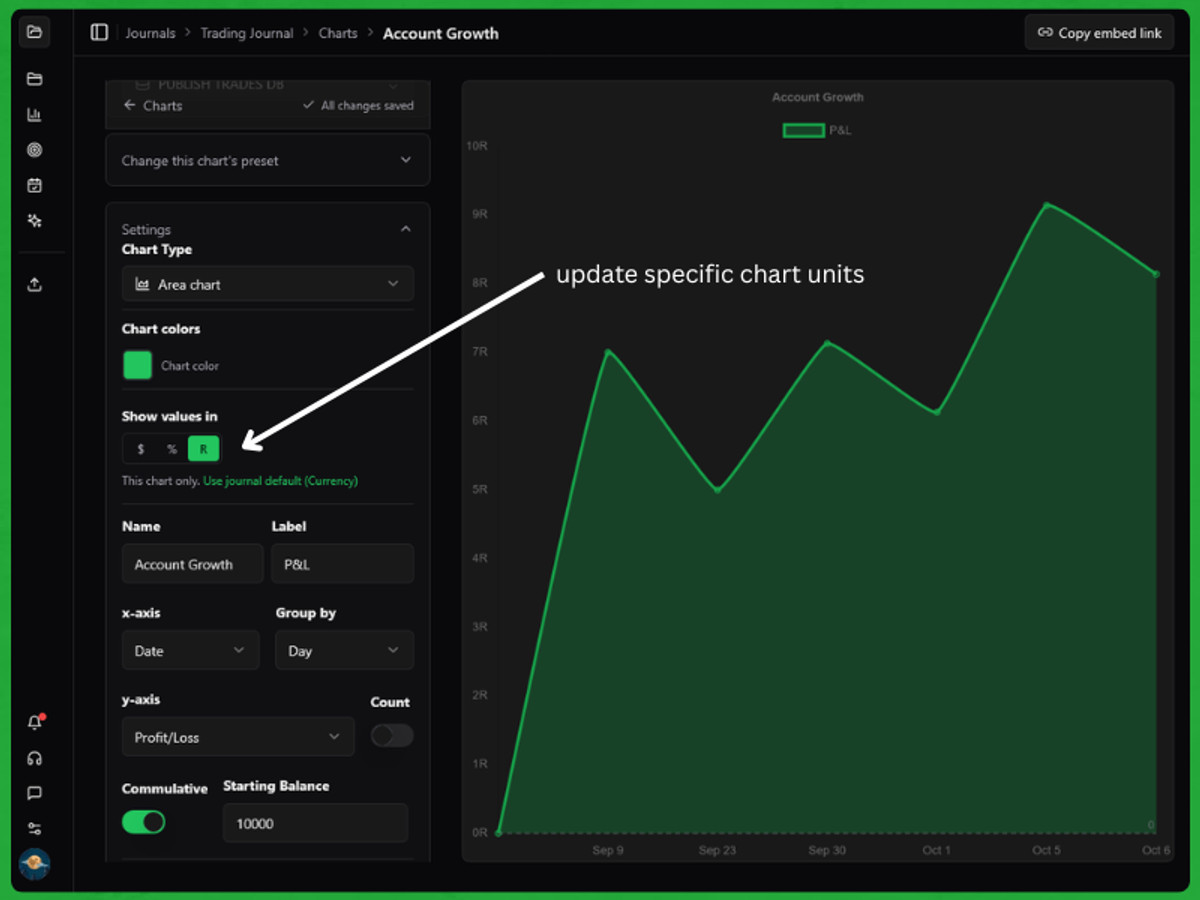
In the chart editor, the Show values in tabs under Chart colors set one chart's unit on its own. Pick the journal's unit again to go back to following the journal. A unit a chart can't use is greyed out, and its tooltip says why. You can also pin an embed with ?display=r or ?display=return on its URL.
The Returns card now always uses your journal's starting balance. In Performance Summary, and any stat cards that include Returns, Total P&L stays in currency under % so the two cards don't repeat each other.
Starting Balance, and Your Results in % and R
Your upload journal now knows how big your account is, so you can read your results the way you think about them: in balance, percent and R.
Starting Balance for Upload Accounts #
Set a starting balance on any upload account to see account growth, % returns and drawdown in %. Find it in the account settings, right on the Account growth chart, or in the new Balance column on the Accounts page.
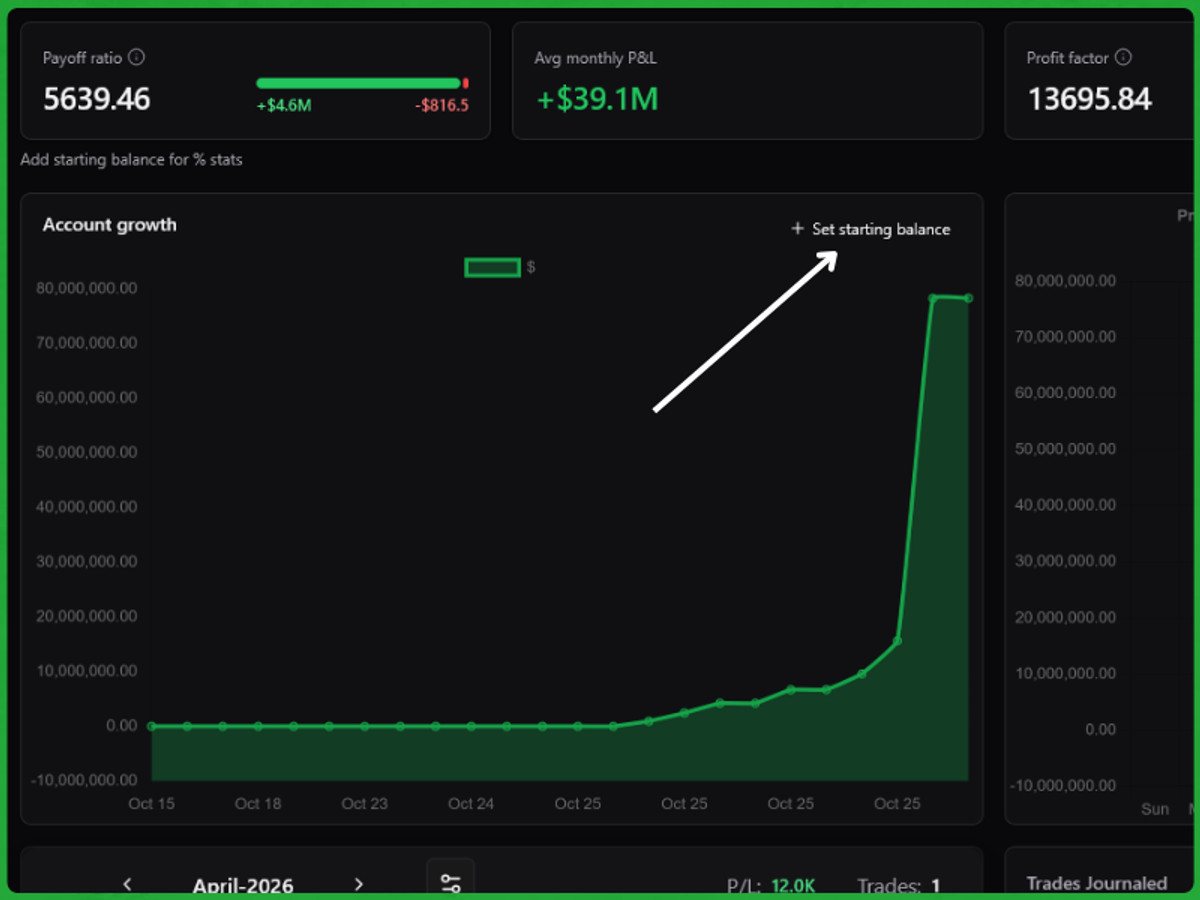
- Account growth (formerly Cumulative P&L) now draws your balance from a dashed start line.
- Drawdown in % of your peak balance, the way prop firms measure it.
- New stat tiles: Balance (with your return), Max drawdown, Expectancy and Payoff ratio. The trade count now sits under Win rate.
Leave the starting balance empty and everything stays in currency, as before. The balance curve assumes no deposits or withdrawals.
Show Everything in $, % or R #
A new $ | % | R switch in the top bar changes every P&L figure on Analytics, the calendar and the Trades table at once:
- % is percent of your starting balance.
- R is P&L divided by your risk per trade. Set a default risk on the account (an amount or a % of your balance). On Pro, add a Risk field to your journal to set it per trade.
Embeds follow the switch too: copy an embed while in % or R and it stays that way.
October 2026
FxJournalStats Badge on Free Embeds
Embeds on the Free plan now carry a small Made with FxJournalStats badge.
🏷️ What changes #
- Free embeds show a subtle badge that links back to FxJournalStats. It's faded until you hover over it, and on stat cards and bar, line and area charts it sits in its own row under the chart, so it never covers your data.
- Every paid plan removes the badge. Nothing to turn on: it disappears as soon as you're on a paid plan.
- Your charts and objectives otherwise work exactly as before.
September 2026
Merge Trades: Scale-Ins and Duplicates, Without Losing Your Journal
Merge trades: combine scale-ins into one trade, or fold duplicate copies together without losing your journal.
Select, Then Merge #
Tick two or more trades in the same account and choose Merge. You'll see the result with real numbers before anything changes.
- Parts of one trade — scaled in or out. Volume, P&L and costs are added up, and prices are volume-weighted, so your win rate counts one idea as one trade.
- The same trade, recorded twice — for a CSV copy and its MT5 Auto Sync twin. Keep one copy's numbers; the other is folded into it.
Your Journal Comes Along #
Notes, attachments and journal fields from every trade move onto the merged trade. Nothing is copied or lost.
Undo Any Time #
Use Undo on the toast, or Unmerge on the trade page later. Merged trades won't come back if Auto Sync or an upload sends them again.
Bulk Select: Delete Multiple Trades at Once
You can now select multiple trades on the Trades page and delete them all at once, instead of one at a time.
What's New #
- Checkboxes on every row — hover a row, or use the header checkbox to select every trade matching your current filters.
- Shift-click to select a range — click one row, hold Shift and click another to select everything in between.
- A selection toolbar — once you've selected trades, it replaces the table header and shows how many are selected next to a Delete button.
- Still undoable — deleting a selection works just like deleting one trade: nothing is gone for good until you say so, and the confirmation toast includes an Undo to bring them straight back with their notes.
Deleted Trades Now Stay Deleted
When you delete a trade, it now stays deleted. Auto Sync won't send it back, and uploading a file that includes it won't re-add it.
Changed your mind? Deleted trades keep their notes, attachments and journal fields, so nothing is lost:
- Press Undo right after deleting — works for a single trade or a whole selection.
- Upload a file that includes trades you already deleted, and the upload summary tells you how many were skipped, with its own Restore button to bring them all back at once.
Uploads now also tell you what happened overall: how many trades were added, how many were already there, and how many were skipped because you deleted them.
Publish Trades Straight to Notion
Your uploaded trades can now go straight into your Notion trading journal — no CSV, no manual mapping every time.
Publish to Notion writes execution data, your journal fields (model, tags, rating, session, and any custom fields you've added), and your trade notes as the page body. It's safe to re-run: a trade that's already in the target database is never written twice, so publishing after every import is the normal way to use it.
How It Works #
- Go to Upload → Settings and filter the trades you want.
- Click Publish to Notion. The first time you publish to a database, you'll confirm the column mapping — after that, it's remembered.
- Keep journaling in Notion: once a trade is published, Notion owns the journal fields and note, and republishing only ever corrects execution data.
The CSV export is still there if you'd rather review a file before it reaches Notion.
Sort Your Trades, and Keep Your Accounts View
The Trades and Accounts tables are easier to navigate, and they now remember how you left them.
Sort the Trades Table #
- Sort by Open Time, Close Time or P&L — click a column header to sort by it, and click again to flip the direction. Find your biggest winners and losers without scrolling the whole list.
- Dates in the time columns — Open Time and Close Time now show the date as well as the time. Hover a time to see the full timestamp with seconds.
Your Accounts View Sticks #
- Sort and tag filters are kept — the sort and tag filters you pick on the Accounts page now stay put when you reload the page or come back from an account's analytics.
- One sort at a time — clicking Name or Platform sorts by that column only, so the arrows always show what the table is actually sorted by.
Share or Bookmark a View #
On both pages, the sort (and on Accounts, the tag filters) is part of the page address. Bookmark it, or copy the link, and it opens in the same order.
MT5 Auto Sync is back
MT5 Auto Sync no longer needs FTP. A small Expert Advisor (EA) now runs inside your MT5 terminal and sends every closed trade straight to your journal.
How to set it up #
Open Add Trades → MetaTrader 5 → Auto Sync and follow the setup steps — download the EA, allow it through MT5's WebRequest whitelist, and attach it to a chart with your API key and account ID.
Notes Feed: Hero Images & Sharper Screenshots
Your trade note screenshots are now front and center on the notes feed — and load a lot sharper when you open them.
What's New #
- Hero image on every card — the first screenshot in a note now shows uncropped at the top of its card, in both list and grid view, instead of being sliced by the old text preview.
- Bigger grid cards — grid cards grew to fit wide chart screenshots with far less empty space down the sides.
- Full-resolution viewer — clicking an image now opens it at its original quality instead of a compressed, resolution-capped copy. Fine chart detail — candle wicks, small text, grid lines — looks noticeably crisper.
- Browse multiple screenshots — notes with more than one image show a +N badge on the card, and the viewer now has Previous/Next buttons (arrow keys work too) to flip through all of a note's images without closing it.
Objective Editor: Improvements
The objective editor has had a clean-up pass: control over how the value is labelled, a friendlier display picker, and reworked drawdown tracking.
What's New #
- Value labels — for money and R-multiple metrics you can now choose Auto or a Custom unit (e.g.
R,pips), and put it before or after the number. A live preview shows exactly how the value will read on the widget. - Reworked drawdown objectives:
- Max Drawdown Limit (renamed from "Drawdown Limit") now measures static drawdown — how far your current net P/L sits below your starting balance. While you're net up it reads 0.
- New Daily Drawdown Limit — today's net loss (UTC day) against a daily loss limit.
- Date-range filter presets — date filters in the objective, calendar and chart editors now offer live presets like this week to date and this month to date, alongside fixed ranges.
Milestones are now Objectives
We've renamed Milestones to Objectives across the app. This is a name change only — how the feature works hasn't changed.
What This Means #
- Nothing to do on your end. Your existing objectives, along with their targets, levels, filters and display settings, are all exactly as you left them.
- Your embeds keep working. Every objective embed URL you've already pasted into Notion stays valid — no links to update.
- New name, same place. You'll see "Objectives" in the sidebar, on your journal cards, and in the editor. The page still lives at the same address.
That's it — carry on tracking your goals.
Embed Editors Auto-Save
All three Notion editors — calendar settings, charts and objectives — now save your changes automatically as you make them.
What's New #
- Auto-save on edits — tweak a colour, swap a column, adjust an objective's target or a calendar's display options, and it's saved a moment later. A small status line shows Saving… → Saved, with a Retry link if a save fails.
- No more surprise redirect — the chart and objective editors used to bounce you back to the list a few seconds after saving. That's gone. Use the Back to charts / Back to objectives / Back to calendars button when you're done.
Formula & Rollup Columns on Your Axes
If you calculate your P/L, R-multiple etc with a Notion formula or rollup, you can use those columns on your charts, calendars and objectives.
What's New #
- Charts — formula and rollup columns now appear in the y-axis and value-column dropdowns, and can be used as the x-axis. Every P/L template (account balance, running P/L, drawdown…) works with a formula P/L.
- Calendars — pick a formula or rollup column as your Profit/Loss or R-Multiple column.
- Objectives — a new Value column picker lets you choose exactly which column drives progress, instead of relying on auto-detection. Existing objectives keep their current column and numbers.
- Relation columns — group and break down charts by a relation (e.g. a linked Strategy, Session or Pair database), and filter by it too.
- More column types as groupings and filters — status and created / last-edited time columns can now be used to group charts and as filter conditions.
- Clearer pickers — a column that can't be used as a number (e.g. a formula that returns text) now shows as a disabled option with the reason, instead of silently disappearing.
Notes #
- No plan requirement — formula and rollup columns behave exactly like plain number columns.
- A formula column needs at least one row with a value so we can tell what it returns; a brand-new or empty column shows with a "waiting for data" note until then.
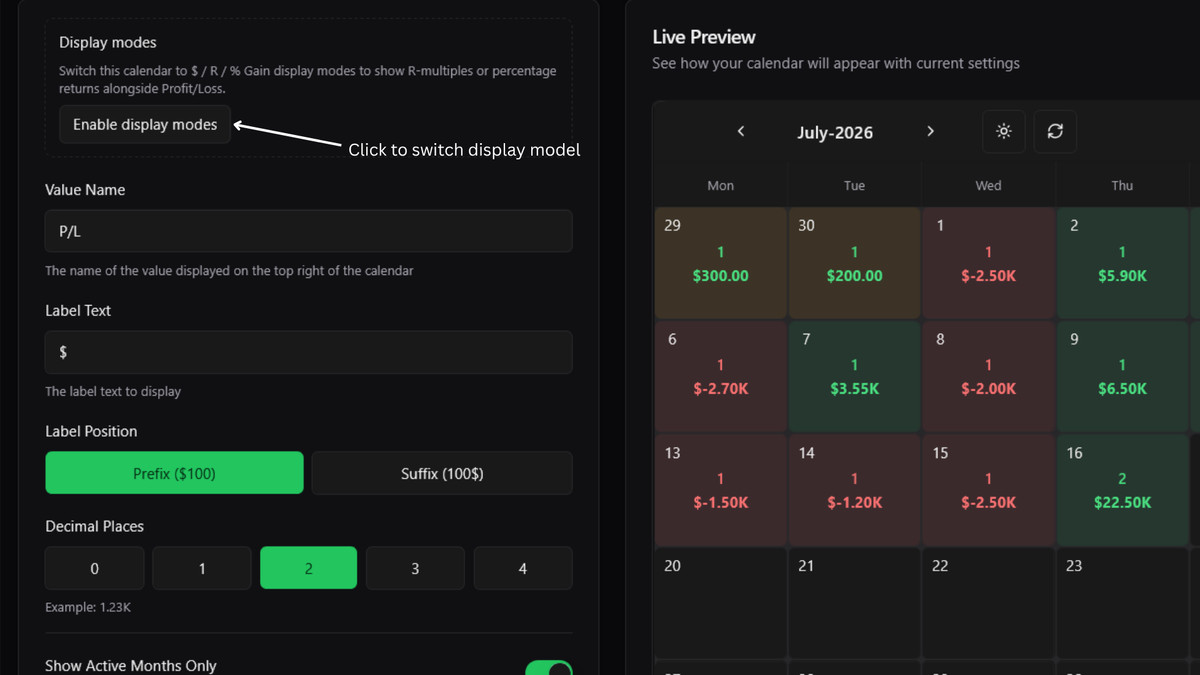
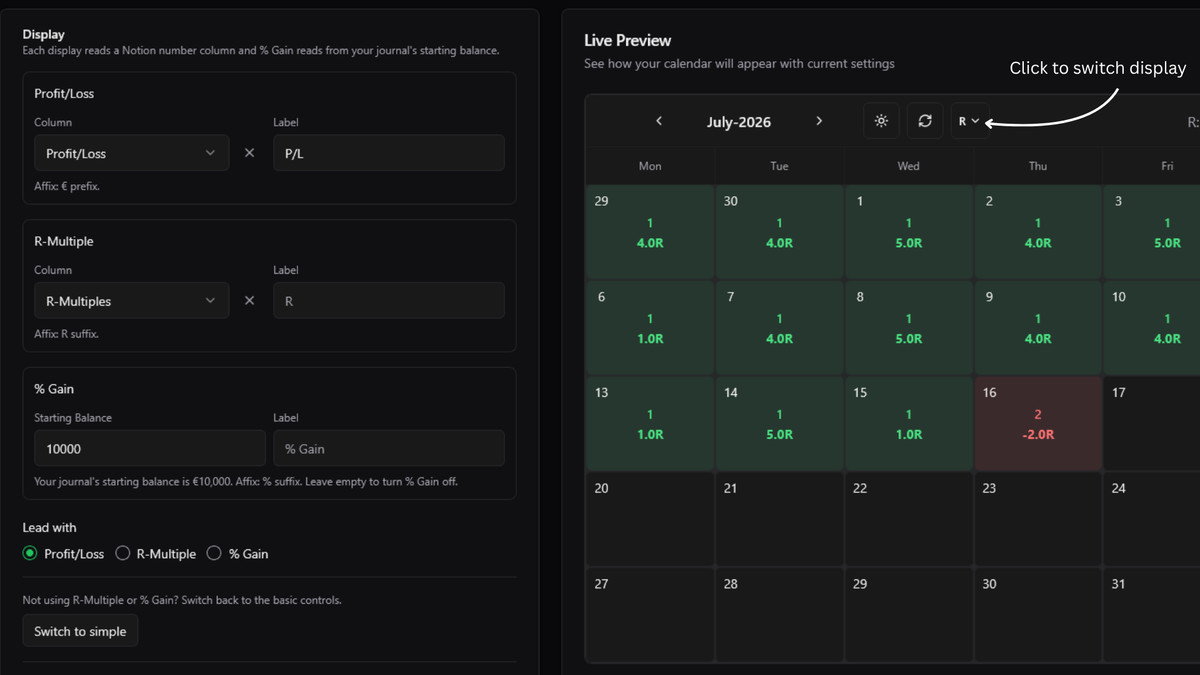
Calendar Display Modes: $ / R / % Gain
Your calendars can now show three different value modes and let you switch between them — on the dashboard and inside your embedded Notion views.
The Three Modes #
- Profit/Loss — your currency P/L, exactly as before (
$,£, …). - R-Multiple — point this at a second Notion number column (your R multiple column) and the calendar totals it in
R. - % Gain — your P/L as a percentage of your starting balance.
Every day cell, weekly total and the Monthly Stats panel follow whichever mode is active.
How to Turn It On #
-
Open a calendar's Settings.
-
Click Enable display modes (new calendars already have it on).
-
In the Display section, choose your R-Multiple column and/or a % Gain starting balance — it's pre-filled from your journal's starting balance, and you can change or clear it.
-
Use Lead with to pick which mode the calendar opens on.
-
Prefer the classic single-value calendar? Switch to Simple switches back any time — nothing you've configured will be lost.
July 2026
AI Trading Reviews (Beta)
Turn your Notion trade journal into AI coaching reports — performance snapshots, rule adherence, breakdowns, and a written review you can read in FxJournalStats or optionally publish back to Notion.
What's New #
- Generate review — run a one-off report for a week or month you choose.
- Automatic reviews — schedule weekly (Sundays 6:00 UTC) or monthly (1st of month 6:00 UTC) runs.
- Coach narrative — AI-written feedback alongside stats, model/session/pair breakdowns, and optional custom Notion fields.
- App-first — every review is saved in FxJournalStats; publishing to a Notion review database is optional.
Requirements #
- Notion journal connected with a trades database
- Map Date and Profit/Loss at minimum; more fields improve coach quality
Get Started #
- Open Reviews from your journal card or dashboard navigation.
- Click Generate review for your first report, or Automatic reviews to set up a schedule.
June 2026
Improved Consistency Score
We've reworked how the Consistency Score is calculated so it better reflects how steady your trading really is.
Why We Changed It #
The old score often showed 0% even for healthy accounts. It compared your swings against your average P/L, so a near-breakeven average or a single great day could drag the score to zero — even when your win rate and profit factor looked great.
What's New #
- Outlier-resistant — one unusually big day no longer wrecks your score.
- Fairer for mixed results — alternating wins and losses now land in a sensible range instead of defaulting to 0%.
- Scale-independent — whether you trade in tens or thousands, the same pattern gets the same score.
- Clearer at a glance — scores now spread naturally across 0–100% so you can actually track improvement over time.
Where You'll See It #
The Consistency Score appears on the Performance Profile radar chart and the Win/Loss Analysis card. Open any chart that uses it to see the updated value.
Remember: the Consistency Score measures how stable your results are, not how profitable — so a steady, well-sized approach scores higher than erratic swings.
AI Column Mapping for Custom Upload
You can now import trades from almost any CSV or XLSX export using Custom Upload.
AI suggests the column mapping, and you stay in control by reviewing it before upload.
What's New #
- Upload CSV, XLSX, or XLS trade exports through Custom Upload.
- Click Auto-map with AI to suggest fields like symbol, side, open time, close time, and profit.
- Review and edit every suggested mapping before importing trades.
- Successful mappings are saved for future files with the same column structure.
Privacy and Control #
AI only receives your column headers and a small sample of rows to suggest the mapping. Trade creation still happens through FxJournalStats validation after you review and apply the mapping.
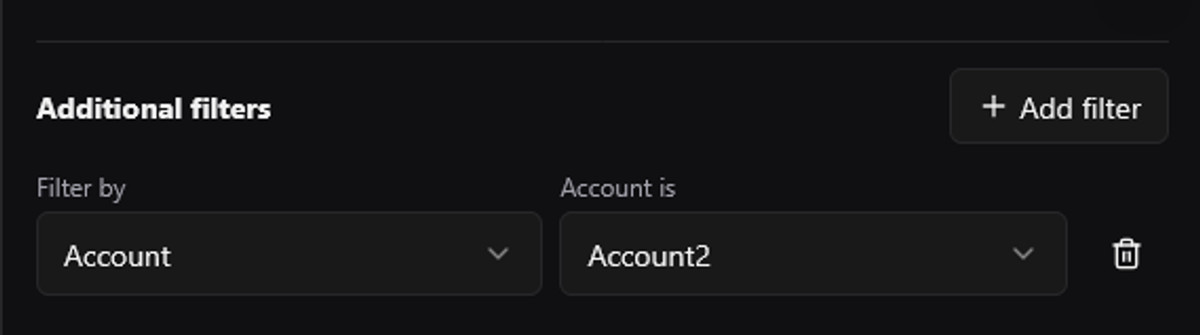
Filters for Calendars and Objectives
You can now add filters to calendars and objectives, just like you already can with charts.
What's New #
- Filter calendar data by select, multi-select, checkbox, and date properties.
- Filter objective progress so each tracker can focus on a specific setup, strategy, market, or tag.
- Saved filters apply to both your editor preview and embedded Notion views.
- Date filters support relative ranges like this week, this month, and this year.
Use filters to create more focused views, such as a calendar for one strategy or an objective tracker for a specific trading setup.
April 2026
Upload Analytics Embeds Are Live
You can now copy upload analytics as embeddable links directly from the Upload Analytics page.
What you can embed #
- Stats cards
- Cumulative PnL
- PnL by weekday
- Calendar
- Drawdown
- Trading activity
- PnL by direction
- Symbol performance over time
How to use it #
- Go to Upload → Analytics.
- Use the Embeds toggle in the top filter bar to show embed copy buttons.
- Click Copy embed above any analytics section and paste the URL where you want to embed it.
Embed links respect your selected accounts and active filters (date range, symbols, and type) at the time you copy.
March 2026
New Chart Templates Available 📊
📊 Four New Chart Templates #
We've added new chart templates so you can analyze your trading in more ways.
What's New #
-
Account Winrate Performance – See win rate % by account (select or multi-select). Wins are derived from your Profit/Loss column (P&L > 0 = win).
-
Rating Performance – Compare average P&L by trade rating. Use a number or select column as your rating (e.g. 1–5 stars, A–F, or custom labels).
-
Positive Tags Performance – Break down performance by your positive tags (e.g. positive comments, filters, or tags).
-
Negative Tags Performance – Break down performance by your negative tags to spot what’s hurting results.
Add a chart and pick one of these from the template list to use them.
February 2026
Custom Colors for Your Charts 🎨
🎨 Pick Your Own Chart Colors #
You can now customize colors on your charts so they match your brand or preferences.
What You Can Do #
- Line, Area & Radar – Choose a single chart color.
- Bar & Horizontal Bar – Set a positive color and a negative color (e.g. green for gains, red for losses).
- Pie, Doughnut & Half-Donut – Use the default palette as-is, or click any color to edit it. Add more colors or remove them to build your own palette.
Changes apply live in the chart preview and are saved when you save the chart.
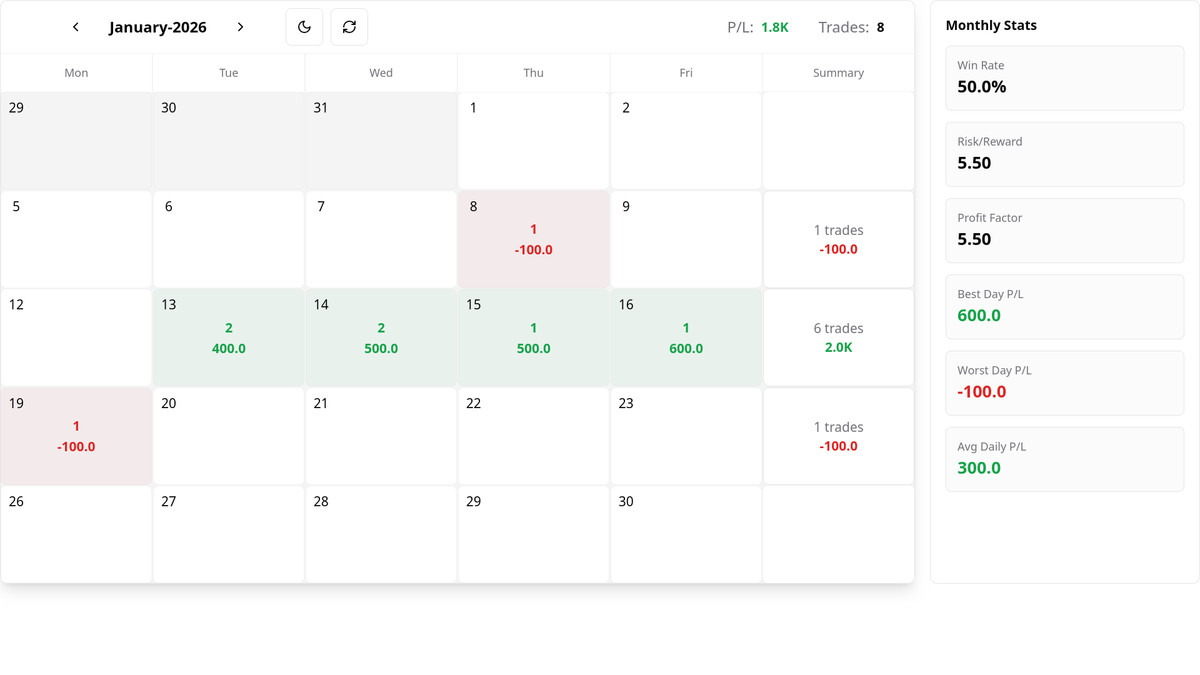
Monthly Calendar Stats Panel
You can now see a monthly stats panel next to your calendar.
What the stats show #
The panel shows six metrics for the current month (the month you’re viewing in the calendar):
- Win rate — Percentage of profitable trades (wins ÷ total trades × 100).
- Best day P/L — Highest single-day profit/loss in the month.
- Worst day P/L — Lowest single-day profit/loss in the month.
- Avg daily P/L — Total month P/L divided by number of trading days.
- Profit factor — Total profit from winning trades ÷ total loss from losing trades.
- Risk/Reward — Average win size ÷ average loss size (per trade).
Stats use your calendar’s label and decimal settings, and are based on individual trades when we have trade-level data.
How to turn the panel on or off #
For one calendar #
- Go to Settings and open the calendar you want (e.g. Dashboard → Settings → [Calendar name]).
- In that calendar’s settings, find Show Monthly Stats.
- Turn the switch on to show the panel next to that calendar, or off to hide it.
For all new calendars (default) #
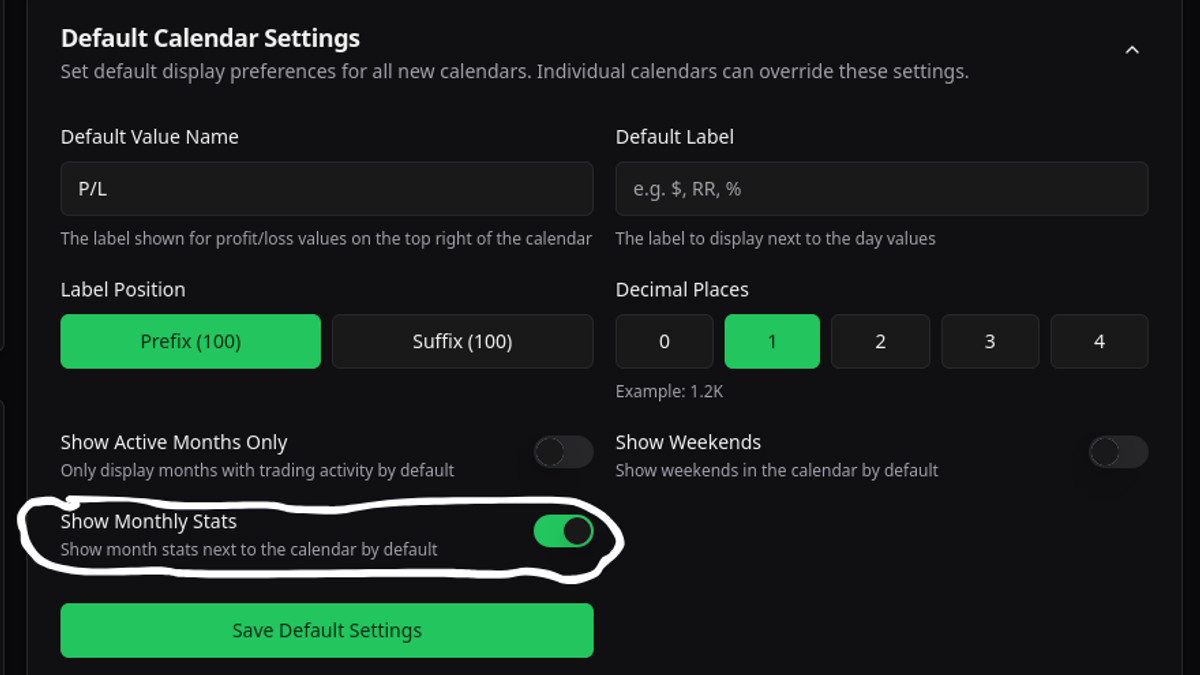
- Go to Settings and open Default Calendar Settings.
- Find Show Monthly Stats and turn it on or off.
- Save. New calendars will use this default; existing calendars keep their own setting until you change them.
The panel appears to the right of the calendar on larger screens and below on smaller ones. If you don’t see it, make sure Show Monthly Stats is enabled for that calendar or in your defaults.
January 2026
New Objective Feature Available! 🏆
We've added a powerful new Objective tracking feature to help you stay motivated on your trading journey!
What's New: #
Track your trading achievements with dynamic progress displays that update automatically with your Notion journal data.
Key Features:
- Create custom progress trackers with multiple achievement levels
- Set achievable goals with visual progress bars, badges, and circular displays
- Track different metrics including trade count, total profit, win rate, and trading streaks
- Celebrate objectives with achievement levels
- Embed directly into your Notion journal for motivation at a glance
November 2025
More Flexibility When Linking Notion
Creating a new trading journal now gives existing Notion users more control.
What's Improved #
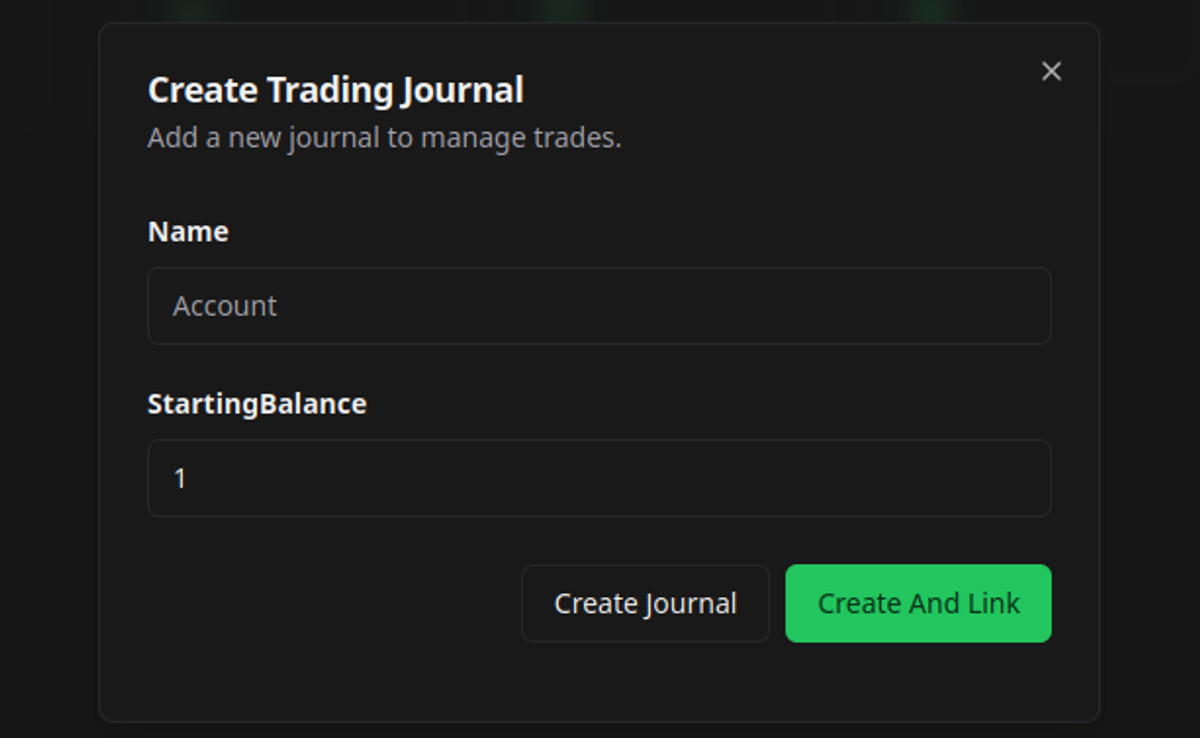
- Stay in the app: When your workspace is already connected to the right Notion account, choose “Create Journal” to skip the OAuth redirect.
- Link on demand: Need to hook up a different Notion space? Hit “Create And Link” to launch the integration flow immediately.
Edit Your Dashboards Faster ⚡
We streamlined how you fine-tune charts, calendars, and objectives.
What's Improved #
-
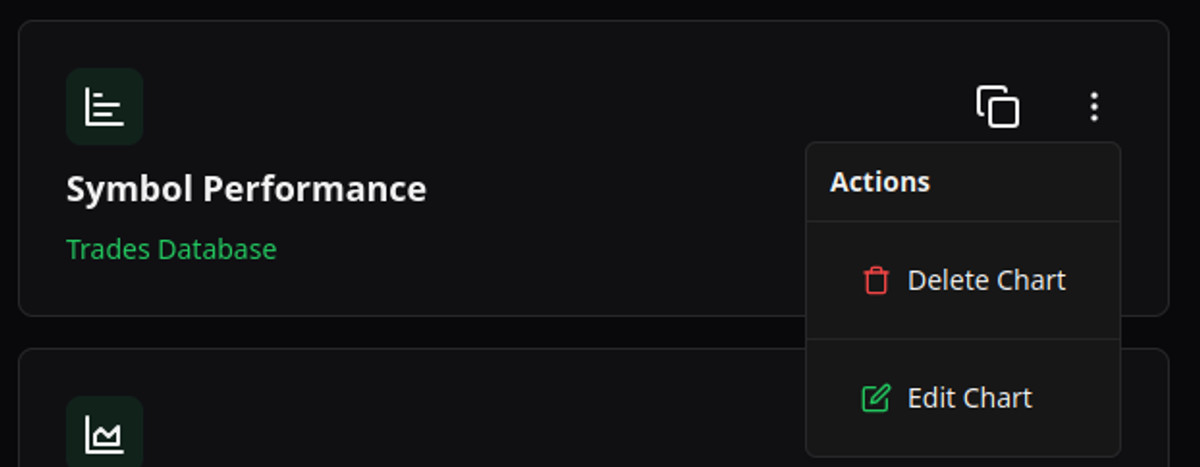
Edit buttons on dashboard cards let you jump straight into editing charts, calendars, and objectives.
-
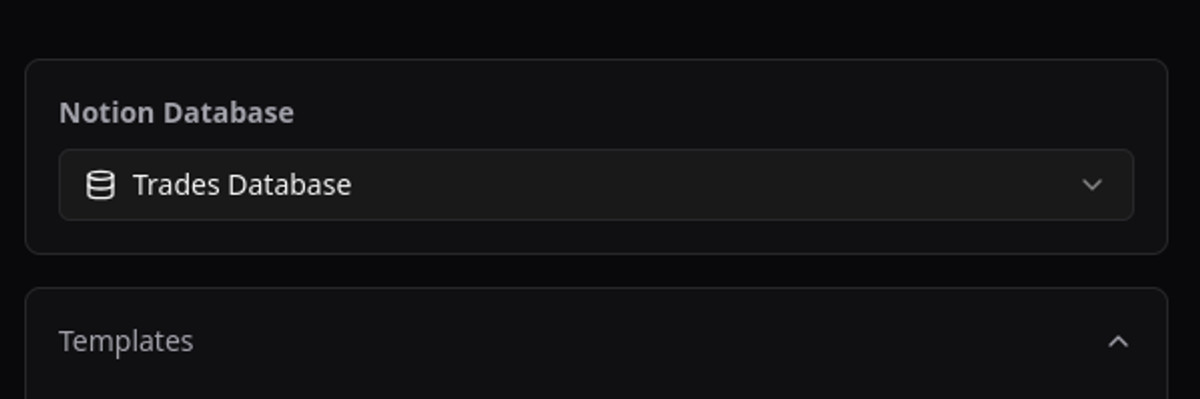
Notion database selector in chart settings makes it easy to swap the source database while you configure a chart.
New Performance Analysis Templates! 📊
We've added two powerful new chart templates to help you analyze your trading performance from different angles!
What's New #
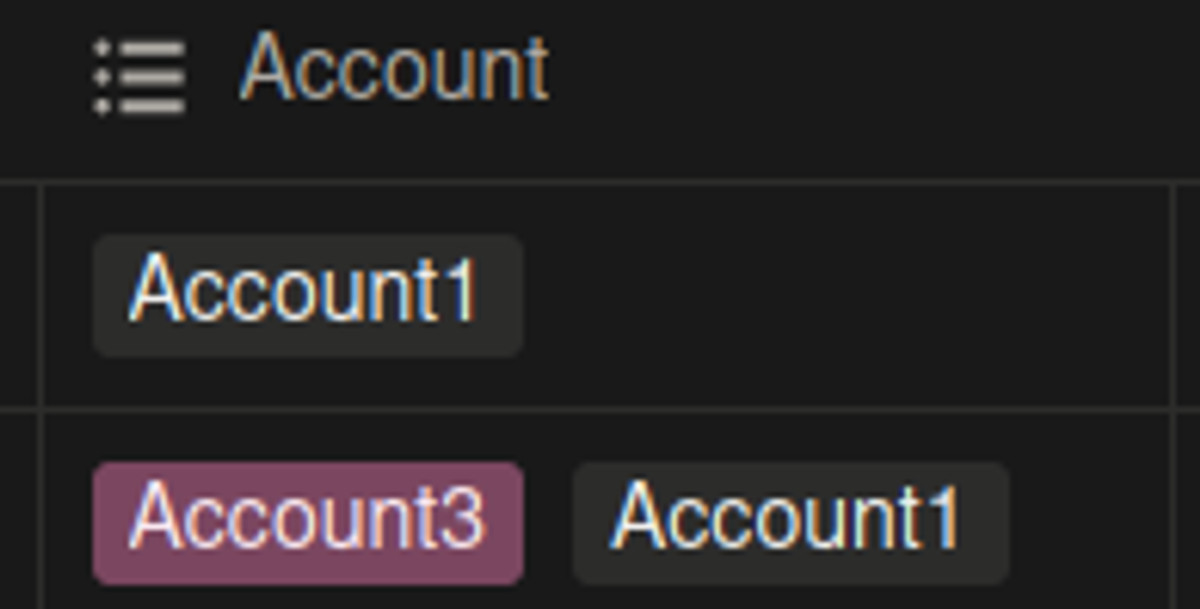
Accounts Performance Template #
Perfect for traders managing multiple accounts within a single database.
Features:
- Compare performance across different accounts at a glance
- See which accounts are contributing most to your overall performance
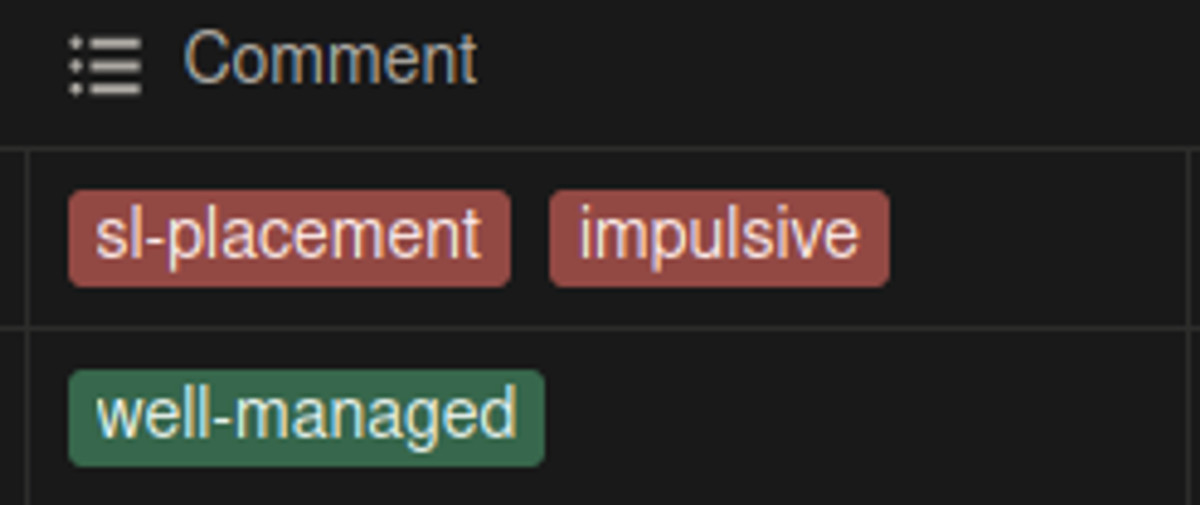
Comments Performance Template #
Ideal for traders who organize trades using comments, filters, or tags.
Features:
- Supports both single select and multi-select columns
- Works with columns named: Comments, Filters, Tags
Get Started #
Open the chart editor and try the new templates →
The templates will automatically detect compatible columns in your Notion database, making setup quick and easy!
October 2025
Chart Updates
We've added several charting improvements to enhance clarity and responsiveness:
What's Improved #
-
New chart type: "linechart"
- Simple, clean line visualization for time series.
-
Drawdown area fixed
- Background fill now correctly renders upward to the zero line for negative values.
-
Pie, Donut, and Half-Donut refreshed
- Updated to a clearer, more responsive presentation for better readability on all screens.
Try It #
Open your chart settings and switch to the new types to see the improvements.
New Templates & Stats Available! 📊
We've significantly expanded our chart templates and statistics to give you deeper insights into your trading performance!
New Templates Added: #
- Performance Profile Radar Chart 5-dimensional performance visualization showing Win Rate, Recovery Factor, Profit Factor, Consistency Score, and Rule Adherence
- Trade Discipline Card Plan adherence tracking - See how often you follow your trading rules
- Streak Analysis Card Multi-timeframe streak patterns - Last 5 trades, days, weeks, and months
- Risk Metrics Card Comprehensive risk indicators - Max drawdown, average loss, biggest loser/winner, Recovery factor
New Statistics Available: #
- Consistency Score Measures performance consistency across your trades
- Plan Adherence Tracks rule-following behavior using checkbox columns
- Recovery Factor Measures ability to recover from drawdowns
- Followed Plan P&L - Performance when rules were followed
- Followed Plan Win Rate - Success rate when disciplined
- Time-based performance metrics - Daily/monthly averages
- Streak pattern analysis - Recent trading patterns
Get Started: #
Turn your trading journal into live analytics.
Charts, calendars and objectives embedded in your Notion journal, or a trade journal that imports from your platform.
Start free