Complete Guide to Chart Templates and Requirements
Updated: October 27, 2025
FxJournalStats offers powerful chart templates to visualize and analyze your trading performance. This comprehensive guide explains what each template does, which Notion columns you need, and how to use them effectively in your trading journal.
Understanding Template Types #
FxJournalStats templates are divided into two main categories:
Visual Charts - Display data over time or by category:
- Area charts (cumulative line charts)
- Bar charts (vertical or horizontal)
- Heat maps (calendar view)
Stat Cards - Display key metrics as individual cards:
- Card charts (multiple stat cards)
- Radar charts (performance profile)
Performance Templates #
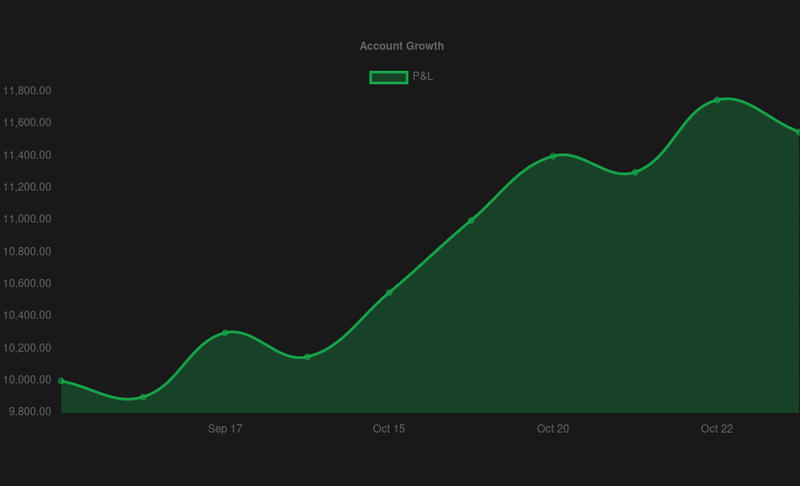
Account Growth Chart #
Chart Type: Area
What it does: Tracks your account balance over time, showing cumulative profit/loss starting from a baseline.
Required Notion Columns:
-
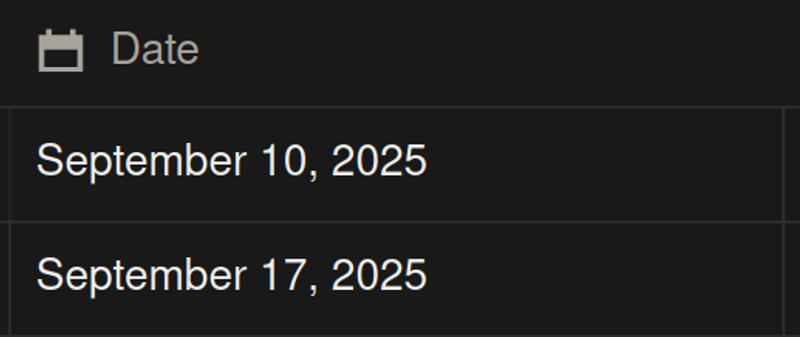
Date column (Date property) - Trade execution date
-
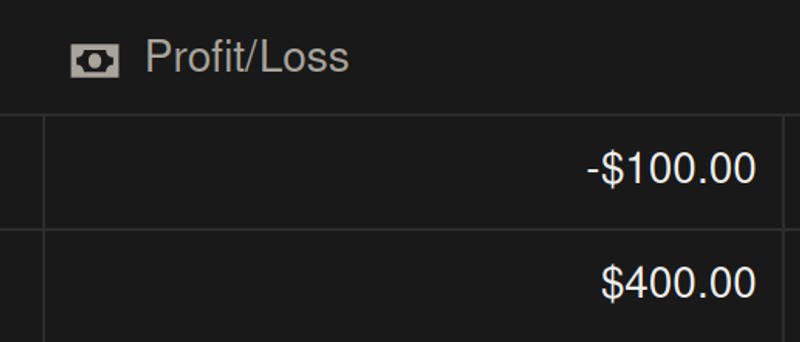
Profit/Loss column (Number property) - Column containing profit or loss values (named "profit", "pnl", "p&l", or "result")
Customization Options:
- Starting balance
- Custom label
- Grouping by Day, Week, or Month
- Filter by any column
Performance Summary Card #
Chart Type: Card
What it does: Displays 5 key performance metrics at a glance: Win Rate, Total P&L, Returns, Profit Factor, and Consistency Score.
Required Notion Columns:
-
Date column (Date property) - Trade execution date
-
Profit/Loss column (Number property) - Column containing profit or loss values
Stats Included:
-
Win Rate
- Calculates: Percentage of profitable trades
- Formula: (Winning trades / Total trades) × 100
- Displays as: XX.X%
-
Total P&L
- Calculates: Sum of all profits and losses
- Shows: Total monetary result
- Displays as: $XXX.XX
-
Returns
- Calculates: Percentage return based on starting balance
- Formula: (Total P&L / Starting Balance) × 100
- Displays as: XX.X%
- Color: Green (positive) or Red (negative)
-
Profit Factor
- Calculates: Ratio of gross profit to gross loss
- Formula: Gross Profit / Gross Loss
- Threshold: >1 is positive, <1 is negative
- Displays as: XX.XX
-
Consistency Score
- Calculates: Measure of performance consistency
- Formula: 1 - (Standard Deviation / Mean)
- Threshold: >70% indicates good consistency
- Displays as: XX.X%
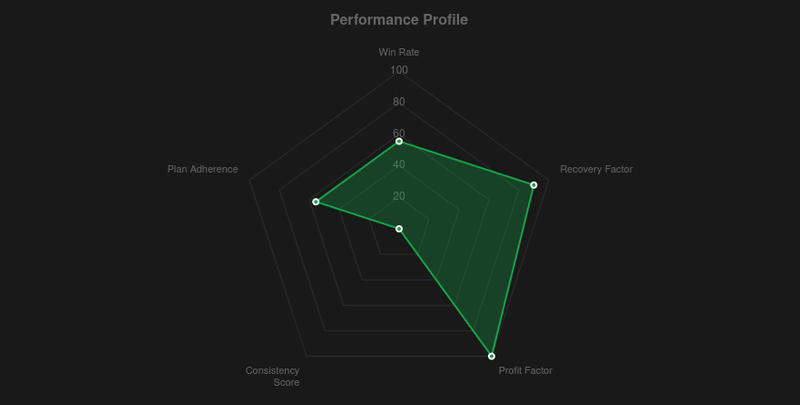
Performance Profile Radar Chart #
Chart Type: Radar
What it does: Creates a radar/spider chart showing 5 performance dimensions for comprehensive profile visualization.
Required Notion Columns:
-
Date column (Date property) - Trade execution date
-
Profit/Loss column (Number property) - Column containing profit or loss values
-
Plan Adherence column (Checkbox property - Optional) - Column indicating if trade followed the plan (named "followed rules", "followed plan", "plan adherence", etc.)

Stats Included:
- Win Rate - Percentage of profitable trades
- Recovery Factor - Ability to recover from drawdowns
- Profit Factor - Gross profit to gross loss ratio
- Consistency Score - Performance consistency measure
- Rule Adherence - Percentage of trades following your plan (if checkbox column exists)
How to read: Each axis represents one metric, with values normalized to 0-100%. A larger area indicates better overall performance.
 #
#
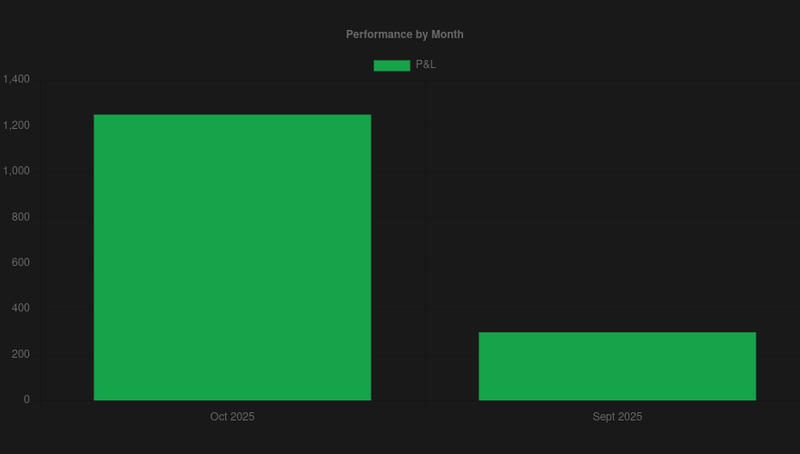
Monthly Performance Chart #
Chart Type: Bar
What it does: Shows profit/loss grouped by month, helping identify seasonal patterns or monthly trends.
Required Notion Columns:
-
Date column (Date property) - Trade execution date
-
Profit/Loss column (Number property) - Column containing profit or loss values
Customization Options:
- Filter by any column
- Custom label
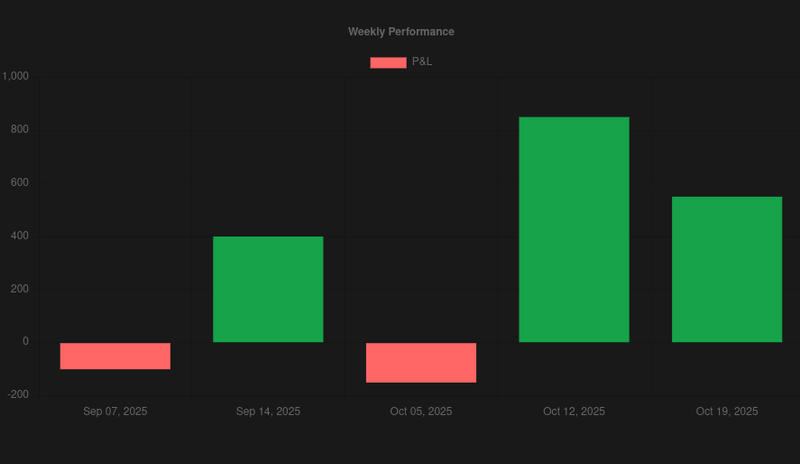
Weekly Performance Chart #
Chart Type: Bar
What it does: Groups trades by week to analyze weekly patterns and performance cycles.
Required Notion Columns:
-
Date column (Date property) - Trade execution date
-
Profit/Loss column (Number property) - Column containing profit or loss values
How it works: Groups all trades by calendar week (Monday to Sunday) and sums P&L for each week.
Daily Performance Chart (Day of Week) #
Chart Type: Bar
What it does: Shows performance by day of week (Monday, Tuesday, etc.) to identify if certain days are more profitable.
Required Notion Columns:
-
Date column (Date property) - Trade execution date
-
Profit/Loss column (Number property) - Column containing profit or loss values
Use case: Discover if you perform better on specific days of the week.
Hourly Performance Chart #
Chart Type: Bar
What it does: Analyzes performance by hour of the day to identify your most profitable trading hours.
Required Notion Columns:
-
Date column (Date property) - Must include time information
-
Profit/Loss column (Number property) - Column containing profit or loss values
Use case: Optimize your trading schedule by finding peak performance hours.
Drawdown chart #
Chart Type: Area
What it does: Visualizes account drawdown over time, showing how much your account has declined from peak values.
Required Notion Columns:
-
Date column (Date property) - Trade execution date
-
Profit/Loss column (Number property) - Column containing profit or loss values
How it works: Calculates cumulative balance, tracks peak, and shows drawdown = Peak - Current Balance
Trading Activity Heat Map #
Chart Type: Heat
What it does: Creates a calendar heat map showing trading activity intensity by day (similar to GitHub contribution graph).
Required Notion Columns:
-
Date column (Date property) - Trade execution date
-
Profit/Loss column (Number property) - Any number column for counting
How it works: Counts number of trades per day and visualizes with color intensity. Darker colors = more trades.
Distribution Templates #
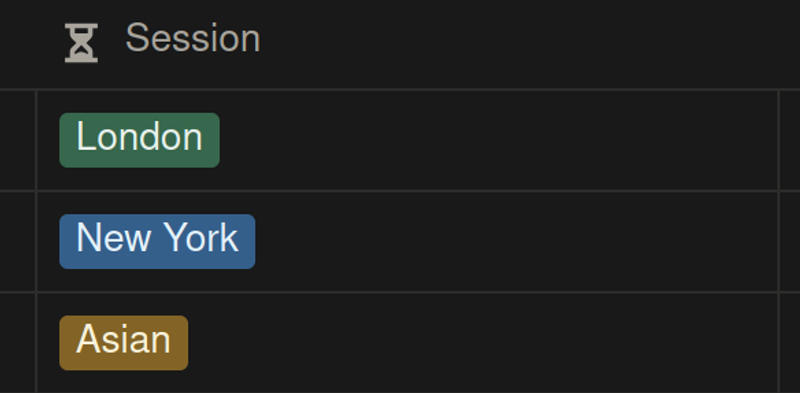
Session Performance Chart #
Chart Type: Bar
What it does: Compares performance across trading sessions (Asian, London, New York, etc.).
Required Notion Columns:
-
Session column (Select property) - Trading session names (should be named "session", "market session", or "trading session")
-
Profit/Loss column (Number property) - Column containing profit or loss values
Use case: Identify which trading sessions are most profitable for you.
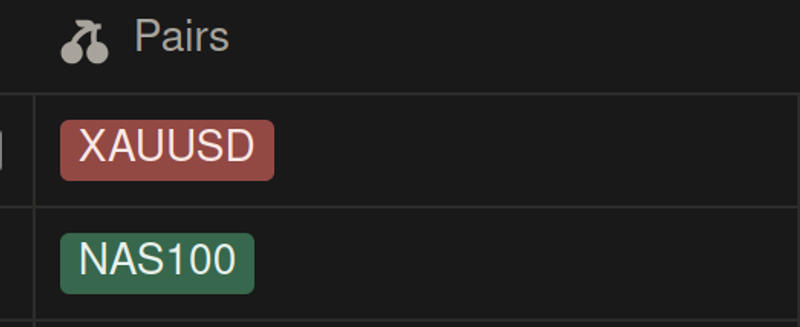
Symbol Performance Chart #
Chart Type: Horizontal Bar
What it does: Shows profit/loss breakdown by trading symbol or currency pair.
Required Notion Columns:
-
Symbol column (Select property) - Trading symbols/pairs (should be named "symbol", "pair", "instrument", or "ticker")
-
Profit/Loss column (Number property) - Column containing profit or loss values
Use case: Identify which currency pairs or instruments are most profitable.
Direction Performance Chart #
Chart Type: Horizontal Bar
What it does: Compares performance of Long vs Short trades.
Required Notion Columns:
-
Direction column (Select property) - Trade direction (should be named "direction", "side", or "trade direction")
-
Profit/Loss column (Number property) - Column containing profit or loss values
Use case: Identify if you perform better with long or short positions.
Model Performance Chart #
Chart Type: Horizontal Bar
What it does: Analyzes performance by trading model, setup, or strategy.
Required Notion Columns:
-
Model column (Select property) - Trading model/strategy (should be named "model", "setup", "strategy", or "playbook")
-
Profit/Loss column (Number property) - Column containing profit or loss values
Use case: Compare different trading strategies and identify top performers.
Entry Window Performance Chart #
Chart Type: Bar
What it does: Shows performance by entry time window (e.g., "7-9 AM", "9-11 AM").
Required Notion Columns:
-
Entry Window column (Select property) - Entry time windows (should be named "Entry Window" or "Entry Time")
-
Profit/Loss column (Number property) - Column containing profit or loss values
Use case: Identify optimal entry time windows.
Risk Templates #
Risk Metrics Card #
Chart Type: Card
What it does: Displays key risk management indicators in card format.
Required Notion Columns:
-
Date column (Date property) - Trade execution date
-
Profit/Loss column (Number property) - Column containing profit or loss values
Stats Included:
-
Max Drawdown
- Calculates: Largest peak-to-trough decline
- Shows: Maximum account decline from peak
- Displays as: -$XXX.XX
-
Average Loss
- Calculates: Average losing trade amount
- Shows: Typical loss size
- Displays as: -$XXX.XX
-
Biggest Loser
- Calculates: Largest single loss
- Shows: Worst trade result
- Displays as: -$XXX.XX
-
Biggest Winner
- Calculates: Largest single win
- Shows: Best trade result
- Displays as: $XXX.XX
-
Recovery Factor
- Calculates: Recovery from drawdowns / Max drawdown
- Threshold: >1 indicates good recovery ability
- Displays as: XX.XX
Streak & Consistency Templates #
Streak Analysis Card #
Chart Type: Card
What it does: Shows recent trading patterns at different time intervals.
Required Notion Columns:
-
Date column (Date property) - Trade execution date
-
Profit/Loss column (Number property) - Column containing profit or loss values
Stats Included:
-
Last 5 Trades
- Shows: Pattern of last 5 individual trades
- Format: W (Win), L (Loss), D (Draw)
- Example: "WWLWL"
-
Last 5 Days
- Shows: Daily P&L pattern of last 5 trading days
- Calculates: Total P&L per day, then pattern
- Example: "WWLW"
-
Last 5 Weeks
- Shows: Weekly P&L pattern of last 5 weeks
- Calculates: Total P&L per week
- Example: "WLLW"
-
Last 5 Months
- Shows: Monthly P&L pattern of last 5 months
- Calculates: Total P&L per month
- Example: "WLWWW"
How to read: W = Winning period, L = Losing period, D = Draw (zero P&L)
Win/Loss Analysis Card #
Chart Type: Card
What it does: Provides detailed breakdown of wins and losses.
Required Notion Columns:
-
Profit/Loss column (Number property) - Column containing profit or loss values
-
Date column (Date property) - Trade execution date (required for validation)
Stats Included:
-
Average Win
- Calculates: Average winning trade amount
- Formula: Sum of wins / Number of wins
- Displays as: $XXX.XX
-
Average Loss
- Calculates: Average losing trade amount
- Formula: Sum of losses / Number of losses
- Displays as: -$XXX.XX
-
Win Rate
- Calculates: Percentage of profitable trades
- Displays as: XX.X%
-
Risk/Reward Ratio
- Calculates: Average Win / Average Loss
- Threshold: ≥2 indicates good risk/reward
- Displays as: XX.XX
- Color: Green (≥2) or Red (<2)
Time-Based Templates #
Time Performance Card #
Chart Type: Card
What it does: Shows time-based profit metrics.
Required Notion Columns:
-
Date column (Date property) - Trade execution date
-
Profit/Loss column (Number property) - Column containing profit or loss values
Stats Included:
-
Average Profit Per Day
- Calculates: Total P&L / Number of unique trading days
- Shows: Daily average profit
- Displays as: $XXX.XX
-
Average Profit Per Month
- Calculates: Total P&L / Number of unique trading months
- Shows: Monthly average profit
- Displays as: $XXX.XX
-
Best Trading Day
- Calculates: Day with highest total P&L
- Shows: Best single day performance
- Displays as: $XXX.XX
-
Worst Trading Day
- Calculates: Day with lowest total P&L
- Shows: Worst single day performance
- Displays as: $XXX.XX
Trade Insights Card #
Chart Type: Card
What it does: Provides overall trading statistics and insights.
Required Notion Columns:
-
Date column (Date property) - Trade execution date
-
Profit/Loss column (Number property) - Column containing profit or loss values
Stats Included:
-
Total Trades
- Calculates: Count of all trades
- Displays as: Number (e.g., "142")
-
Average Trades Per Day
- Calculates: Total trades / Number of unique trading days
- Displays as: Number (e.g., "3")
-
Best Trading Day
- Calculates: Day with highest P&L
- Displays as: $XXX.XX
-
Worst Trading Day
- Calculates: Day with lowest P&L
- Displays as: $XXX.XX
Discipline Templates #
Trade Discipline Card #
Chart Type: Card
What it does: Measures adherence to your trading plan by tracking which trades followed your rules.
Required Notion Columns:
-
Plan Adherence column (Checkbox property) - Indicates if trade followed plan (should be named "followed rules", "followed plan", "plan followed", etc.)
-
Profit/Loss column (Number property) - Column containing profit or loss values (for counting purposes)
Stats Included:
-
Trade Plan Adherence
- Calculates: Percentage of trades where plan was followed
- Formula: (Trades with checkbox = true / Total trades) × 100
- Displays as: XX.X%
- Threshold: ≥80% indicates good discipline
-
Followed Plan P&L
- Calculates: Total P&L from trades that followed the plan
- Shows: Performance when rules were followed
- Displays as: $XXX.XX
-
Followed Plan Win Rate
- Calculates: Win rate for trades that followed the plan
- Shows: Success rate when disciplined
- Displays as: XX.X%
- Threshold: Compare with overall win rate
Use case: Identify correlation between discipline and profitability.
Quick Reference: Column Name Patterns #
FxJournalStats uses pattern matching to automatically detect column types. Use these naming conventions:
Date Columns:
-
Contains: "date", "time", "timestamp", "created"
Profit/Loss Columns:
-
Contains: "profit", "pnl", "p&l", "result"
Session Columns:
-
Contains: "session", "market session", "trading session"
Symbol Columns:
-
Contains: "symbol", "pair", "instrument", "ticker"
Direction Columns:
-
Contains: "direction", "side", "trade direction"
Model/Strategy Columns:
-
Contains: "model", "setup", "strategy", "playbook"
Entry Window Columns:
-
Contains: "Entry Window", "Entry Time"
Plan Adherence Columns:
- Contains: "followed rules", "followed plan", "plan followed", "plan adherence", "adherence"
Tips for Using Templates #
- Start with Performance Summary - Get a quick overview before drilling into specifics
- Use filters - Most templates support filtering to analyze specific date ranges or conditions
- Compare timeframes - Group by different periods (day/week/month) to identify patterns
- Track discipline - Use the Trade Discipline card to ensure you're following your plan
- Identify winners - Use Symbol and Model performance charts to focus on profitable areas
Troubleshooting #
Template not showing data:
- Verify column names match the required patterns
- Check that data types match (Date, Number, Select, Checkbox)
- Ensure your Notion integration has access to the database
Stats showing 0 or N/A:
- Check that you have sufficient data (some stats need minimum 3 trades/days)
- Verify the date column contains actual dates, not just created timestamps
- For checkbox columns, ensure you have some true values
Conclusion #
FxJournalStats templates provide comprehensive tools to analyze every aspect of your trading performance. Whether you want to track account growth, analyze session performance, or measure trading discipline, there's a template for your needs.
Ready to start analyzing your trades? Create your first chart and begin uncovering insights from your trading data.
For more guides: