Trading Chart Examples: Complete Settings Guide for FXJournalStats
Updated: May 17, 2025
Trading Chart Examples: Complete Settings Guide for FXJournalStats
Transform your trading data into actionable insights with these proven chart configurations. Each example includes exact settings you can use in FXJournalStats to create powerful trading visualizations.
Table of Contents
- 1. Account Growth Chart 📈
- 2. Day of the Week Performance Chart 📊
- 3. Symbol Performance Comparison 📊
- 4. Symbol Distribution Pie Chart 🥧
- 5. Monthly Performance Overview 📈
- 6. Trade Frequency Analysis 📊
- 7. Session Performance Analysis 📊
- 8. Direction Performance (Long vs Short) 📊
- 9. Overall stats Card 🥧
- 10. Yearly Performance Overview 📈
- Chart Type Recommendations
- Pro Tips for Implementation
- Data Requirements
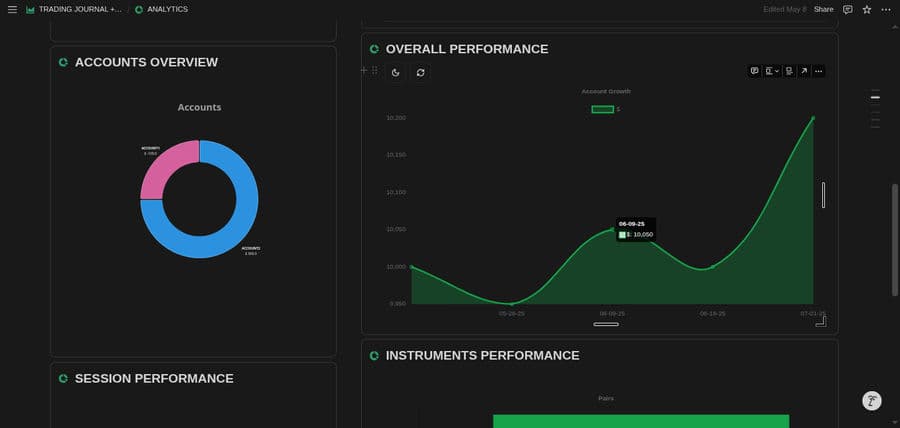
1. Account Growth Chart 📈
Purpose: Track your account balance over time with cumulative profit/loss
Settings:
| Setting | Value |
|---|---|
| chartType | Area chart |
| name | Account Growth |
| label | $ |
| x-axis | Date |
| y-axis | profit |
| groupBy | day |
| commulative | true |
| startingBalance | 10000 |
| count | false |

What it shows: A smooth area chart displaying your account balance progression from your starting balance, accumulating each trade's profit/loss over time.
Best for: Long-term performance tracking, identifying growth trends, and visualizing compound effects of your trading.
2. Day of the Week Performance Chart 📊
Purpose: Analyze which days of the week are most profitable for your trading
Settings:
| Setting | Value |
|---|---|
| chartType | bar chart |
| name | Performance By Weekday |
| label | $ |
| x-axis | Date |
| y-axis | profit |
| groupBy | DOW |
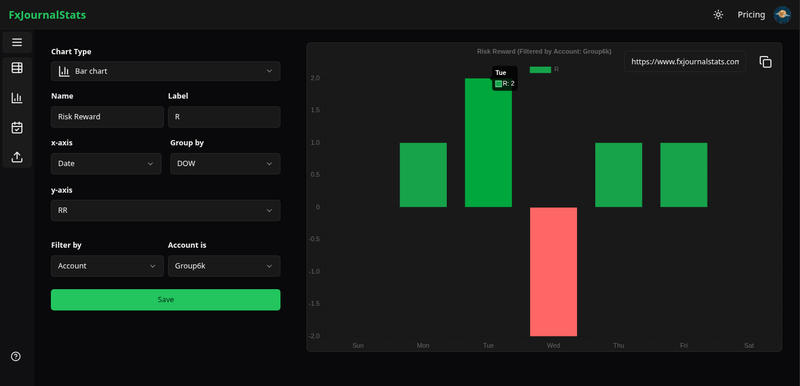 What it shows: Bar chart comparing total profit/loss for each day of the week (Monday through Sunday).
Best for: Identifying optimal trading days, avoiding consistently losing days, and optimizing your trading schedule.
3. Symbol Performance Comparison 📊
Purpose: Compare performance across different currency pairs or instruments
Settings:
| Setting | Value |
|---|---|
| chartType | bar chart |
| name | Symbols Performance |
| label | P&L |
| x-axis | symbol |
| y-axis | profit |
| commulative | false |
 What it shows: Horizontal or vertical bar chart showing total profit/loss for each trading symbol.
Best for: Identifying your most profitable instruments, focusing on high-performing pairs, and avoiding consistently losing symbols.
4. Symbol Distribution Pie Chart 🥧
Purpose: Visualize the proportion of trades and profit/loss by symbol
Settings:
| Setting | Value |
|---|---|
| chartType | pie chart |
| name | Symbol Distribution |
| label | P&L |
| x-axis | symbol |
| y-axis | profit |
| commulative | false |
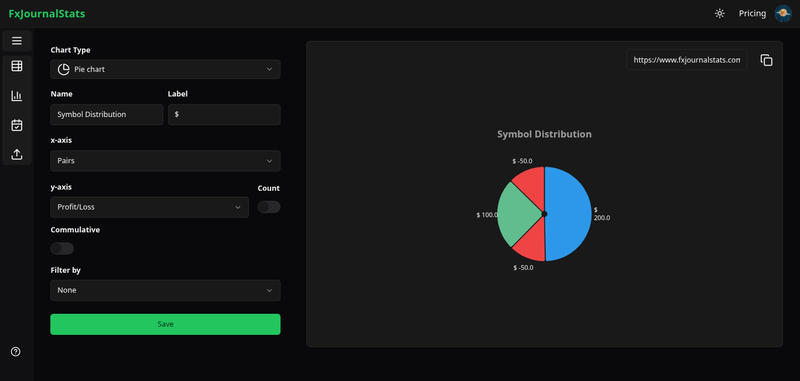 What it shows: Pie chart displaying the percentage distribution of profit/loss across different symbols.
Best for: Understanding portfolio allocation, identifying concentration risk, and balancing your trading across instruments.
5. Monthly Performance Overview 📈
Purpose: Track performance trends month by month
Settings:
| Setting | Value |
|---|---|
| chartType | bar chart |
| name | Monthly Performance |
| label | Monthly P&L |
| x-axis | date |
| y-axis | profit |
| groupBy | month |
| commulative | false |
 What it shows: Bar chart with monthly aggregated profit/loss, helping identify seasonal patterns and monthly trends.
Best for: Seasonal analysis, monthly goal tracking, and identifying periods of consistent performance.
6. Trade Frequency Analysis 📊
Purpose: Analyze how many trades you're taking over time
Settings:
| Setting | Value |
|---|---|
| chartType | bar chart |
| name | Trades per Month |
| label | No of Trades |
| x-axis | date |
| y-axis | profit |
| groupBy | month |
| count | true |
 What it shows: Bar chart displaying the number of trades taken each month, regardless of profit/loss.
Best for: Understanding trading frequency patterns, identifying over-trading periods, and maintaining consistent activity levels.
7. Session Performance Analysis 📊
Purpose: Compare performance across different trading sessions
Settings:
| Setting | Value |
|---|---|
| chartType | bar chart |
| name | Session Performance |
| label | P&L by Session |
| x-axis | session |
| y-axis | profit |
| commulative | false |
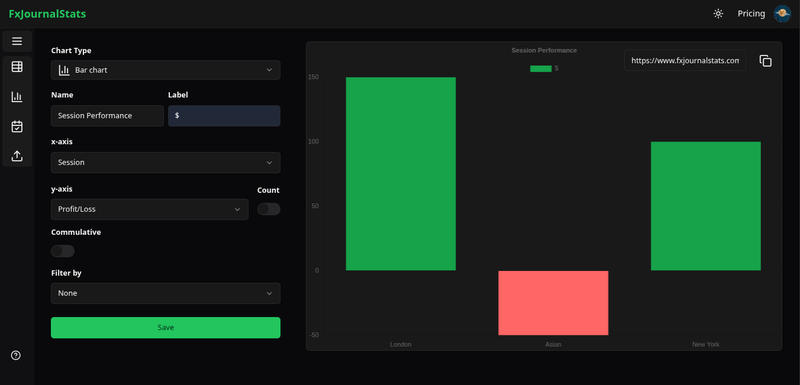 What it shows: Bar chart comparing profit/loss across Asian, London, and New York sessions.
Best for: Identifying your most profitable trading sessions, optimizing trading hours, and focusing on high-performing time periods.
8. Direction Performance (Long vs Short) 📊
Purpose: Compare performance between long and short positions
Settings:
| Setting | Value |
|---|---|
| chartType | horizontal |
| name | Direction Performance |
| label | P&L by Direction |
| x-axis | direction |
| y-axis | profit |
| commulative | false |
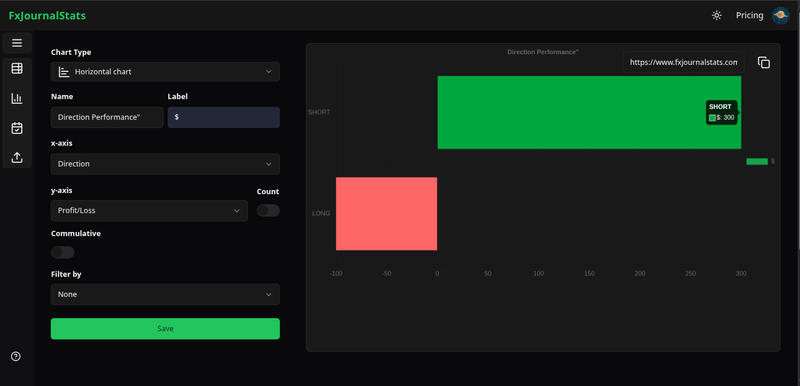 What it shows: Horizontal bar chart comparing total profit/loss for long vs short positions.
Best for: Identifying directional bias, improving position sizing, and balancing long/short exposure.
9. Overall stats Card 🥧
Purpose: Visualize your overall stats
Settings:
| Setting | Value |
|---|---|
| chartType | Card Stat |
| name | Overall Stats |
| profit/loss | profit |
| starting value | 10000 |
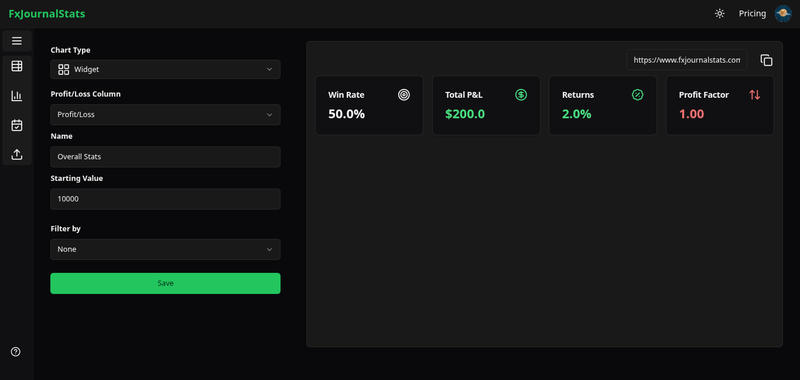 What it shows: Cards displaying overall stats
Best for: Tracking win rate, understanding risk/reward balance, and monitoring trading consistency.
10. Yearly Performance Overview 📈
Purpose: Long-term annual performance tracking
Settings:
| Setting | Value |
|---|---|
| chartType | area |
| name | Yearly Performance |
| label | Annual P&L |
| x-axis | date |
| y-axis | profit |
| groupBy | year |
| commulative | false |
What it shows: Area chart displaying yearly profit/loss totals.
Best for: Long-term performance analysis, annual goal tracking, and multi-year trend identification.
Chart Type Recommendations
- Area Charts: Best for trends over time and cumulative data
- Bar Charts: Best for comparisons between categories
- Horizontal Bar Charts: Best for many categories with long labels
- Pie Charts: Best for proportions and percentages
- Doughnut Charts: Best for proportions with better visual appeal
- Half-Donut Charts: Best for progress indicators and goal tracking
Pro Tips for Implementation
-
Start with Account Growth: Always begin with a cumulative account growth chart to understand your overall performance trajectory.
-
Use Multiple Timeframes: Create the same analysis across different time groupings (day, week, month, year) to identify patterns.
-
Combine Chart Types: Use cards for summary statistics alongside detailed charts for comprehensive analysis.
-
Filter Strategically: Use filtering to focus on specific aspects of your trading (symbols, sessions, directions).
-
Track Consistently: Update your charts regularly to maintain current insights and identify emerging patterns.
Data Requirements
Ensure your trading data includes these essential fields:
- date /openTime: Date fields for temporal analysis
- profit: Numerical profit/loss values
- symbol: Trading instrument names
- session: Trading session identifiers
- direction: Long/short position indicators
- win: Boolean win/loss indicators
By implementing these chart configurations, you'll gain comprehensive insights into your trading performance, identify patterns, and make data-driven decisions to improve your trading strategy.
Suggested Posts
Step-by-Step Guide to Adding Analytics (Charts & Calendars) to Your Notion Journal with FxJournalStats
Learn how to enhance your Notion journal with powerful analytics using FxJournalStats. This guide walks you through creating custom charts and calendars, linking them to your Notion database, and tracking data visually for better insights and productivity.
Read more
How to Create Custom Charts in Your Notion Journal: A Step-by-Step Guide
Follow this step-by-step guide to create and embed custom charts into your Notion journal...
Read more
A Step-by-Step Guide to Adding a Custom Calendar to Your Notion Journal for Better Tracking
This guide walks you through adding a custom calendar to your Notion journal step-by-step...
Read more